Study: Student Loans Weigh Heaviest on Black, Hispanic Students
Student loan debt in the U.S. has reached massive levels, and students of color are shouldering the greatest burden. Black students, for instance, are much more likely to borrow federal student loans than their white classmates.
To take a closer look at the disparities among student loan borrowers, LendingTree researchers analyzed recent government data with an eye toward how higher student debt can lead to financial difficulties after college and higher rates of student loan default.
Key findings
- Nearly 9 in 10 Black students take out federal student loans to pay for college, compared with 7 in 10 white students.
- Black students are far more likely to be saddled with large student debt than their white, Hispanic or Asian classmates. In fact, 59.5% of Black students borrow more than $29,500.
- Financial struggles appear to line up with student loan default rates. Black borrowers are more than twice as likely as white borrowers to default on their student loans.
- The median household income — $41,511 — for Black families is about $25,000 less than that of white households.
Table of contents
87.4% of Black graduates borrow federal student loans
Black graduates borrow at a much higher rate than the national average at all school types, according to the National Center for Education Statistics (NCES). In total, 87.4% of Black students borrowed for college, compared with:
- 72.2% of Hispanic students
- 69.7% of white students
- 48.5% of Asian students
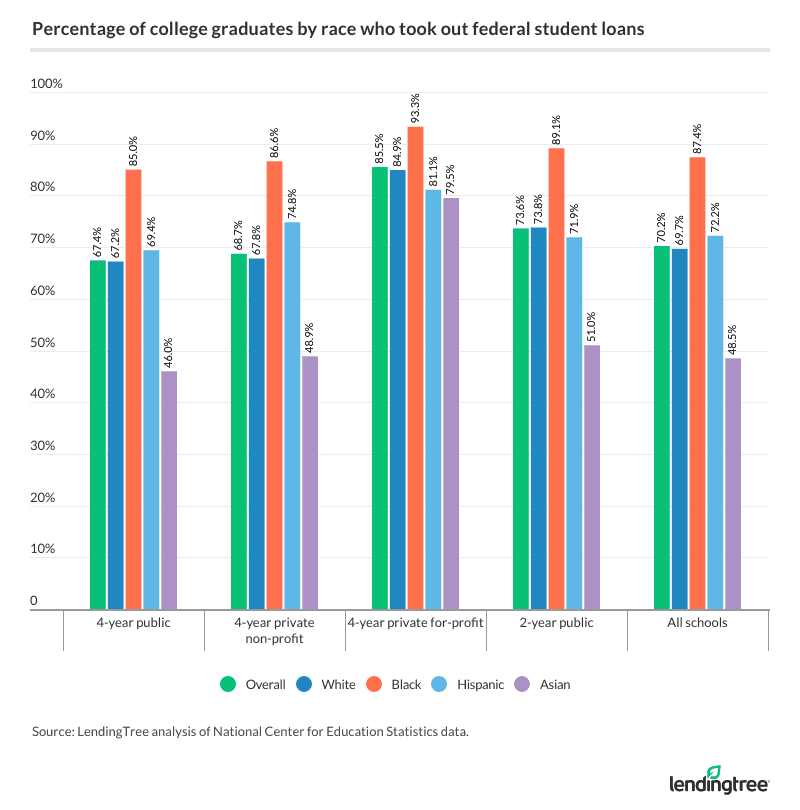
The disparity was greatest at four-year colleges. At four-year public colleges, 85% of Black students graduated with debt, compared with 67.2% of white students and 46% of Asian students. At four-year private, nonprofit schools, 86.6% of Black students had education debt, as opposed to 67.8% of white graduates and 48.9% of Asian graduates.
Hispanic students also saw heightened rates of borrowing, with:
- 69.4% of students graduating with debt from 4-year public colleges
- 74.8% holding loans from 4-year private schools
However, the rates of borrowing among Hispanic students were slightly lower at for-profit schools and community colleges than those of their white and Black counterparts.
The NCES data also revealed relatively high rates of borrowing to attend four-year private, for-profit colleges, with an average of 85.5% of students borrowing across all racial groups. While some for-profit schools may provide valuable skills training, others engage in questionable practices and fail to provide adequate value. Students should be cautious about taking on too much debt for a for-profit school to avoid an insufficient return on their investment.
Nearly 60% of Black graduates borrow more than $29,500
Not only are Black students taking on student debt at higher rates than other racial groups, but they also appear to be borrowing greater amounts. Across all school types, 59.5% of Black students borrowed more than $29,500.
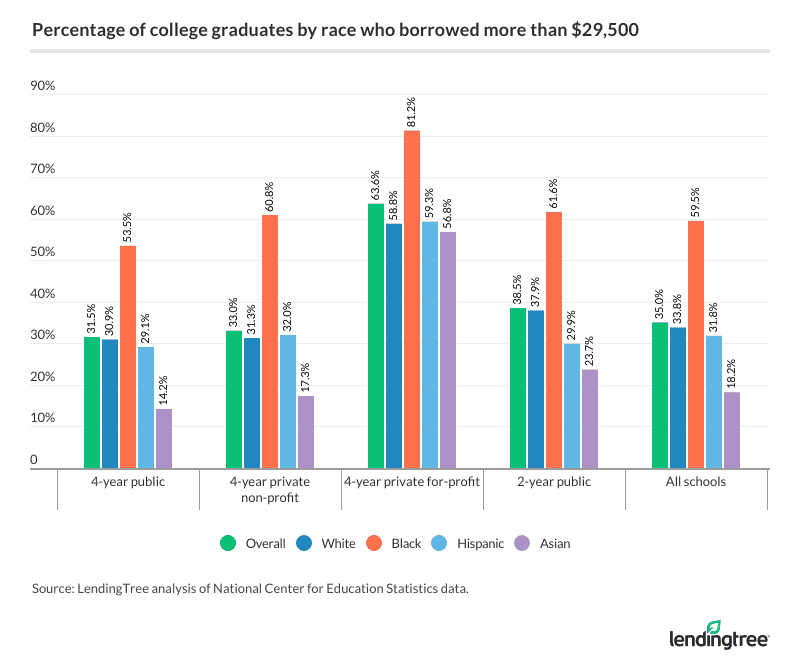
Among white and Hispanic students, that number was 33.8% and 31.8%, respectively. Among Asian students, that number was significantly lower at 18.2%. Overall, the average percentage of students graduating with more than $29,500 in loans was 35%.
The disparity between Black and white students is especially high at four-year private, nonprofit colleges, where nearly double the percentage of Black students (60.8%) than white students (31.3%) owed more than $29,500.
Across all racial groups, the NCES found a high number of students had taken on significant debt to pay for-profit schools. Overall, 63.6% of students took on more than $29,500 for for-profit schools, compared with:
- 31.5% at 4-year public schools
- 33% at 4-year nonprofit, private schools
- 38.5% at community colleges
Financial challenges may act as a barrier to graduating on time
Having to take on large amounts of debt may act as a roadblock to completing college on time. While 42.6% of students in the Class of 2017 graduated in four years or less, that number drops to:
- 28.8% among Black students
- 29.7% among Hispanic students
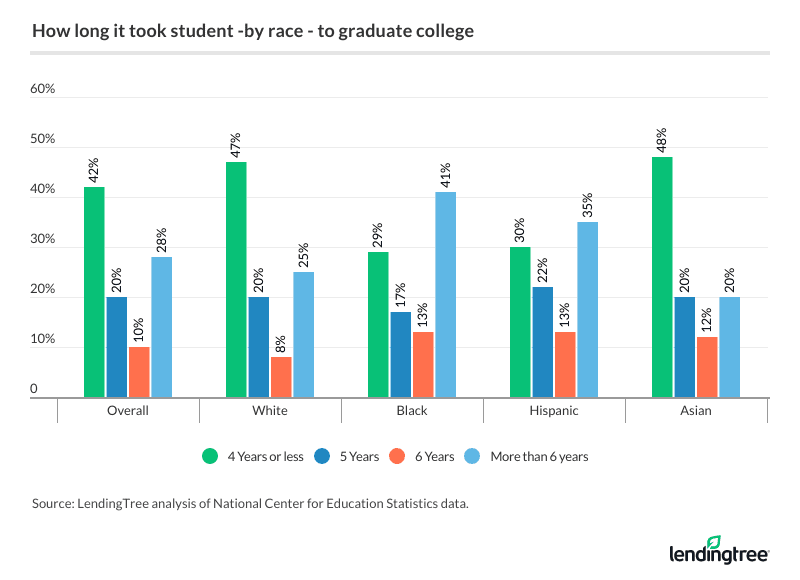
For white and Asian students, the rates were higher than average at 46.7% and 48.5%, respectively. Conversely, more Black students — 40.7% — took more than six years to graduate college, compared with:
- 35.2% for Hispanic students
- 25.3% for white students
- 19.7% for Asian students
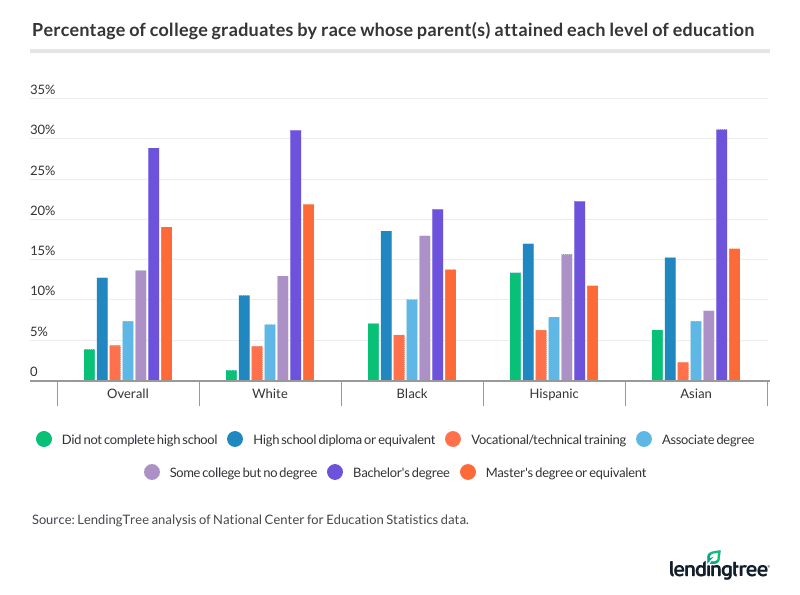
The data further revealed inequities in educational attainment. Among white students, 31% had parents who obtained a bachelor’s degree. For Black and Hispanic students, the percentages were lower at 21.2% and 22.2%, respectively.
Student debt may contribute to financial difficulties after college
While students have a reprieve from paying back their federal loans while enrolled in school, they’re expected to make payments when their grace period ends six months after graduation. For many students who are still job searching and dealing with other expenses, these payments can put a major strain on their finances.
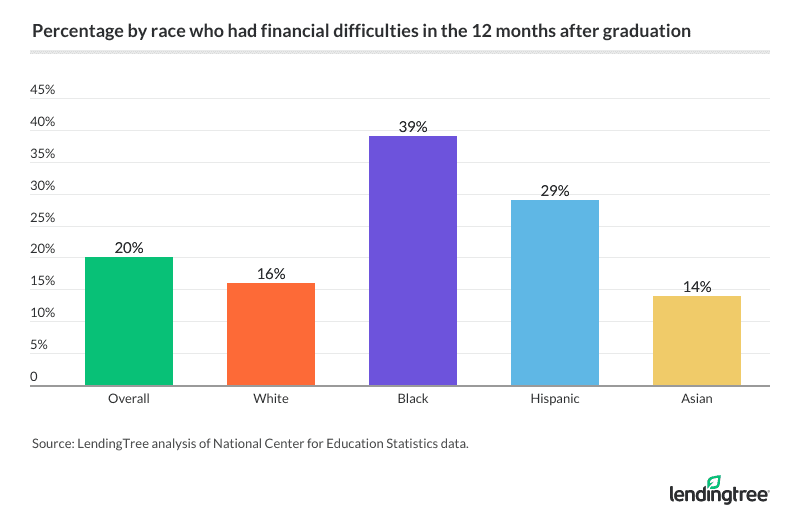
According to the NCES data, 1 in 5 students reported financial difficulties in the 12 months after graduation. Among Black students, that number was nearly double at 39%. Among Hispanic students, 29% reported financial challenges, while 16% of white students reported the same.
If student loan payments eat up a major portion of your budget, you’ll have less left over for housing, vehicle and other expenses, not to mention less to funnel into savings. Borrowers who are struggling could consider adjusting their student loan payments on an income-driven repayment plan.
Black graduates see larger balances, higher default rates
On average, students owed $27,480 in federal loans one year after earning their undergraduate degree. When you take interest and fees into account, that amount increased to $29,883.
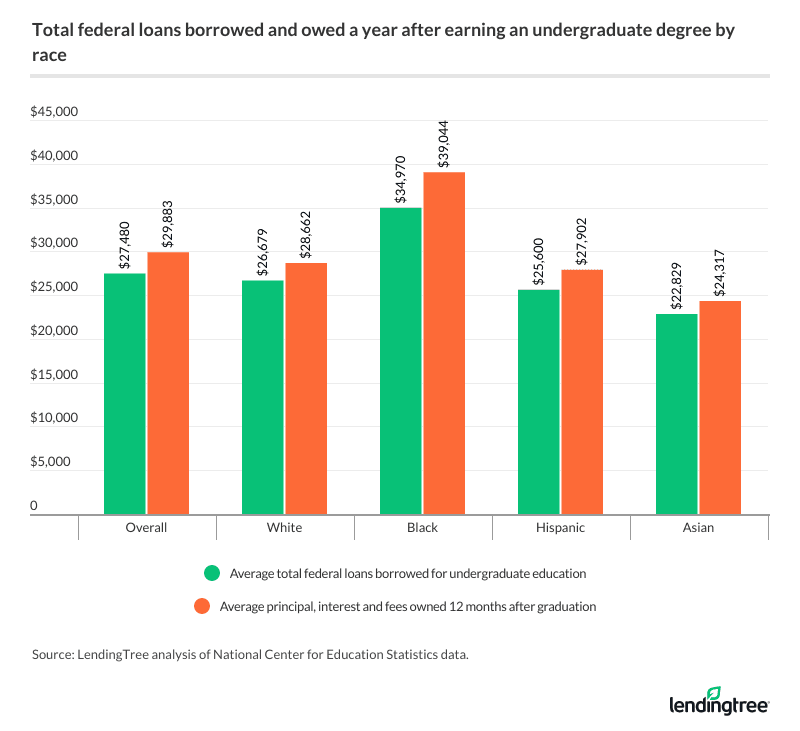
For Black students, the debt burden was higher at $39,044 (including interest and fees). Among white students, that number was nearly $11,000 less, at $28,662.
This debt burden, combined with the higher rate of financial difficulties described above, likely contributes to the higher rate of student loan default among Black borrowers.
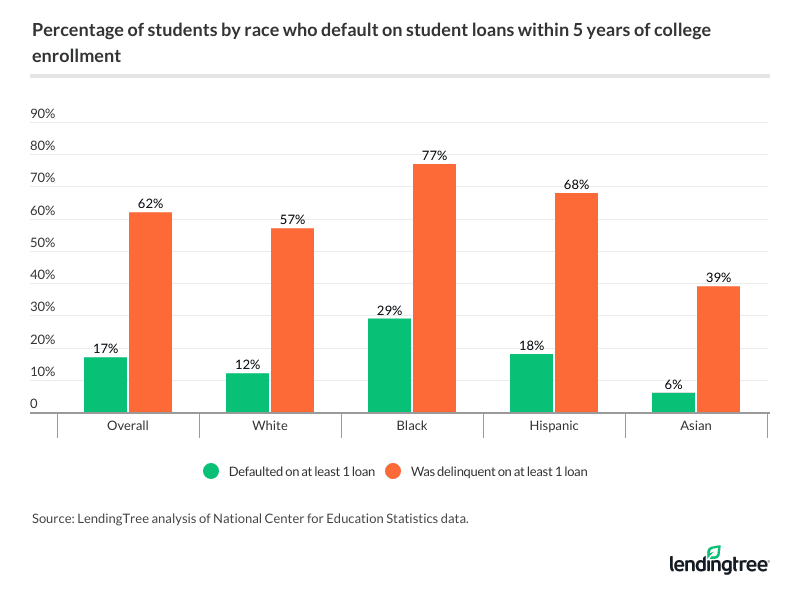
Federal student loan default occurs when a borrower misses a payment for 270 days or more. The average rate of default on at least one loan five years after enrollment in college was 16.5%.
For Black students, the rate of default was 29.3%, whereas for white students it was less than half that at 12.2%. Rates of student loan delinquency (missing payments for less than 270 days) were also high among Black students, 77.2%, compared with:
- 67.6% among Hispanic students
- 56.5% among white students
- 62% across all groups
Falling behind on student loan payments can tank your credit score, as well as lead to garnishment of wages, tax refunds and Social Security benefits. Because there’s no statute of limitations on federal student loans, the negative financial consequences of default can be lifelong.
High student loan debt goes hand in hand with racial wealth gap
These major disparities in student loan debt don’t exist in isolation from other areas of the economy. The U.S. has a massive wealth gap between Black and white families.
The Brookings Institution found “staggering racial disparities” in families’s net worth, with the typical net worth of a white family being $171,000 in 2016, compared with $17,150 for a Black family.
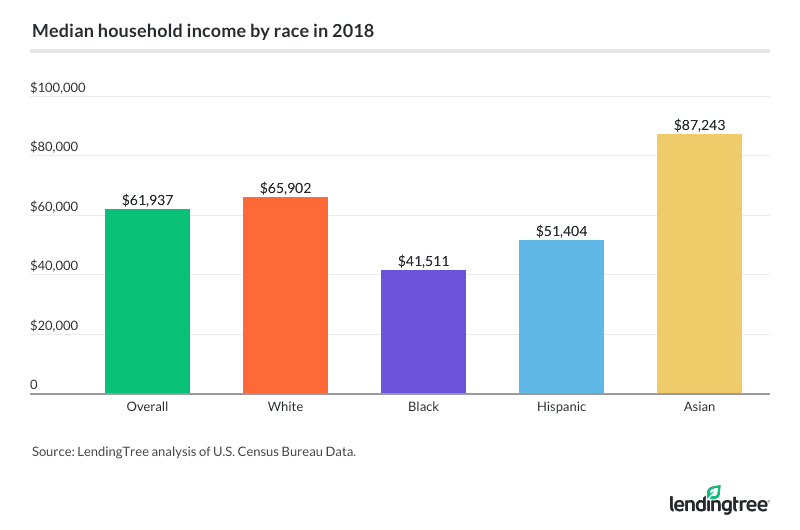
According to the U.S. Census Bureau, the median household income for Black families in 2018 was about $20,000 less than the national median ($41,511, compared with $61,937) and nearly $25,000 less than the median for white households ($65,902).
Lower income means less money to pay for college, which in turn impacts student loan borrowing. High student loan payments eat up a significant portion of a graduate’s earnings or even lead to default, making it even harder to build net worth.
Because of this cycle, unequal rates of student loan borrowing don’t just stem from the wealth gap in the U.S. but may widen it more.
Facing the unequal burden of student loan debt
Across the U.S., 45 million borrowers owe $1.64 trillion in student loan debt. But that debt isn’t divided equally among all borrowers.
On the contrary, it weighs the heaviest on Black students, who borrow at greater rates and higher amounts than other groups. After graduation, a greater number of Black students had financial difficulties, according to NCES, which in turn may contribute to higher rates of student loan delinquency and default.
Federal student loans can be a useful tool for covering college costs and gaining the economic mobility that can come with a bachelor’s degree. But when rising tuition costs outpace income growth and massive student loan borrowing becomes the norm, the burden of student debt may begin to outweigh the benefits of a college degree.
For historically disenfranchised Black Americans, student loan debt can exacerbate, rather than dismantle, the racial and socioeconomic inequities that plague the U.S.
Methodology
Researchers analyzed data from the Beginning Postsecondary Student (2012-2017) and Baccalaureate and Beyond (2017) longitudinal surveys from the National Center for Education Statistics to determine certain financial, debt and educational outcomes by race. Overall figures also include the following groups: American Indians and Alaska Natives, Native Hawaiians and Pacific Islanders, and those identifying as more than one race. Household income data by race is from the 2018 American Community Survey from the U.S. Census Bureau. All sources are the most up-to-date available.
